Monitoring a website is super important for developers. It helps you figure out what’s causing issues like why your website is down, why requests are taking too long, or what might be slowing things down in general.
That’s where Prometheus and Grafana come in.
Prometheus is used to collect metrics from endpoints that you define (like your server or apps). Grafana takes those metrics from Prometheus and turns them into easy-to-understand graphs and dashboards, so you can actually see what’s going on behind the scenes.
What This Guide Covers and Prerequisites
This guide is intended for beginners who want to learn the basics of setting up Prometheus and Grafana for monitoring their website. I’ll cover how to write a YAML configuration file for the Prometheus server, how to containerize it using Docker, and how to pull the Grafana image and use its dashboard. Prerequisites
Basic knowledge of Linux/command line

Docker (for containerization)

Basic understanding of YAML

Familiarity with any backend language (I'm using Flask in this guide)
Setting Up Prometheus
Creating an flask server
from flask import Flask
from prometheus_flask_exporter import PrometheusMetrics

app = Flask(__name__)
metrics=PrometheusMetrics(app)
@app.route('/')
def test():
    return "hello world"

if __name__ == '__main__':
    app.run(host='0.0.0.0',debug=True)
In the above program, I have created a PrometheusMetrics instance and passed the app object as an argument. This automatically sets up an endpoint (/metrics) that exposes application metrics, which Prometheus can scrape.
Now, if you open the website and go to endpoint /metrics you would now see this.
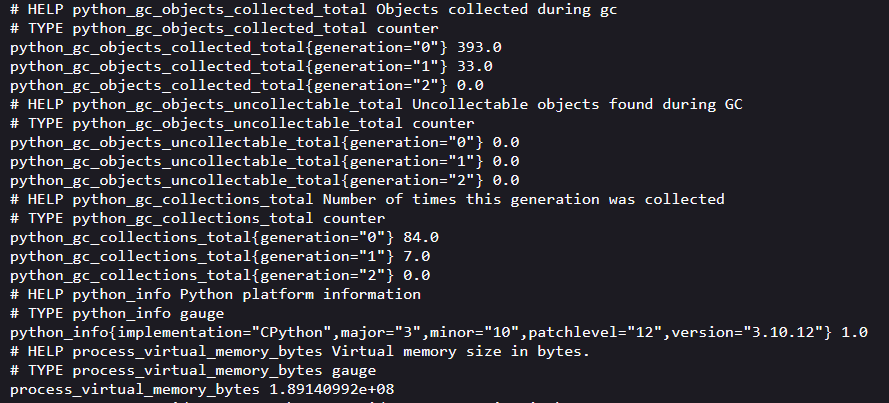
if you find any problem or get error 404 turn off the debug mode or run export DEBUG_METRICS=1 then run the application.
- prometheus server
- Create a prometheus-config.yml to put the prometheus configuration.
global:
 scrape_interval: 4s # it'll scrape the metrics from the end point every 4s

scrape_configs:
 - job_name: prometheus
   static_configs:
- targets: ["<you-target-address>"] # put you private address here to make that as your end-point- creating a docker container for prometheus server
version: "3"

services:
 prom-server:
   image: prom/prometheus
   ports:
     - 9090:9090
   volumes:
     - ./prometheus-config.yml:/etc/prometheus/prometheus.yml
This container pulls the prom/prometheus image and listens on port 9090 on my machine (host), forwarding it to port 9090 inside the container. It uses Docker volumes to bind ./prometheus-config.yml (on the host) to /etc/prometheus/prometheus.yml (inside the container), so any changes made to the config file on the host will be reflected in the container at runtime.
Summary of Prometheus Setup
I created a Flask app and used PrometheusMetrics to integrate Prometheus with it by passing the Flask app instance. This setup automatically exposed a /metrics endpoint, where all the raw data is available. Then, I used a Prometheus Docker container and specified a prometheus.yml file inside it to define which address to scrape the metrics from. Now, Prometheus collects the metrics from my Flask app and stores the data so it can be used for monitoring and visualization.
Setting Up Grafana
Setting up Grafana is simple — just run it in a Docker container:
docker run -d -p 3000:3000 --name=grafana grafana/grafana-oss
There are two versions of Grafana:
Grafana OSS (Open Source Software) — free and open to use (this is the one we’re using)

Grafana Enterprise — has extra features for businesses
After running the container, open your browser and go to:
http://localhost:3000
You’ll see the Grafana login page. Use the default credentials:
Username: admin

Password: admin
Grafana will ask you to set a new password — choose anything you like. Connect Grafana to Prometheus
Once you’re logged in:
Click on “Add your first data source”

Choose Prometheus

In the URL box, enter the address of your Prometheus server, for example:
For example, if your Prometheus server is running at 172.20.54.207 on port 5000, enter: http://172.20.54.207:5000
Scroll down and click “Save & Test” You should see a green success message that says Grafana is connected to Prometheus.
That’s it — you’re all set!
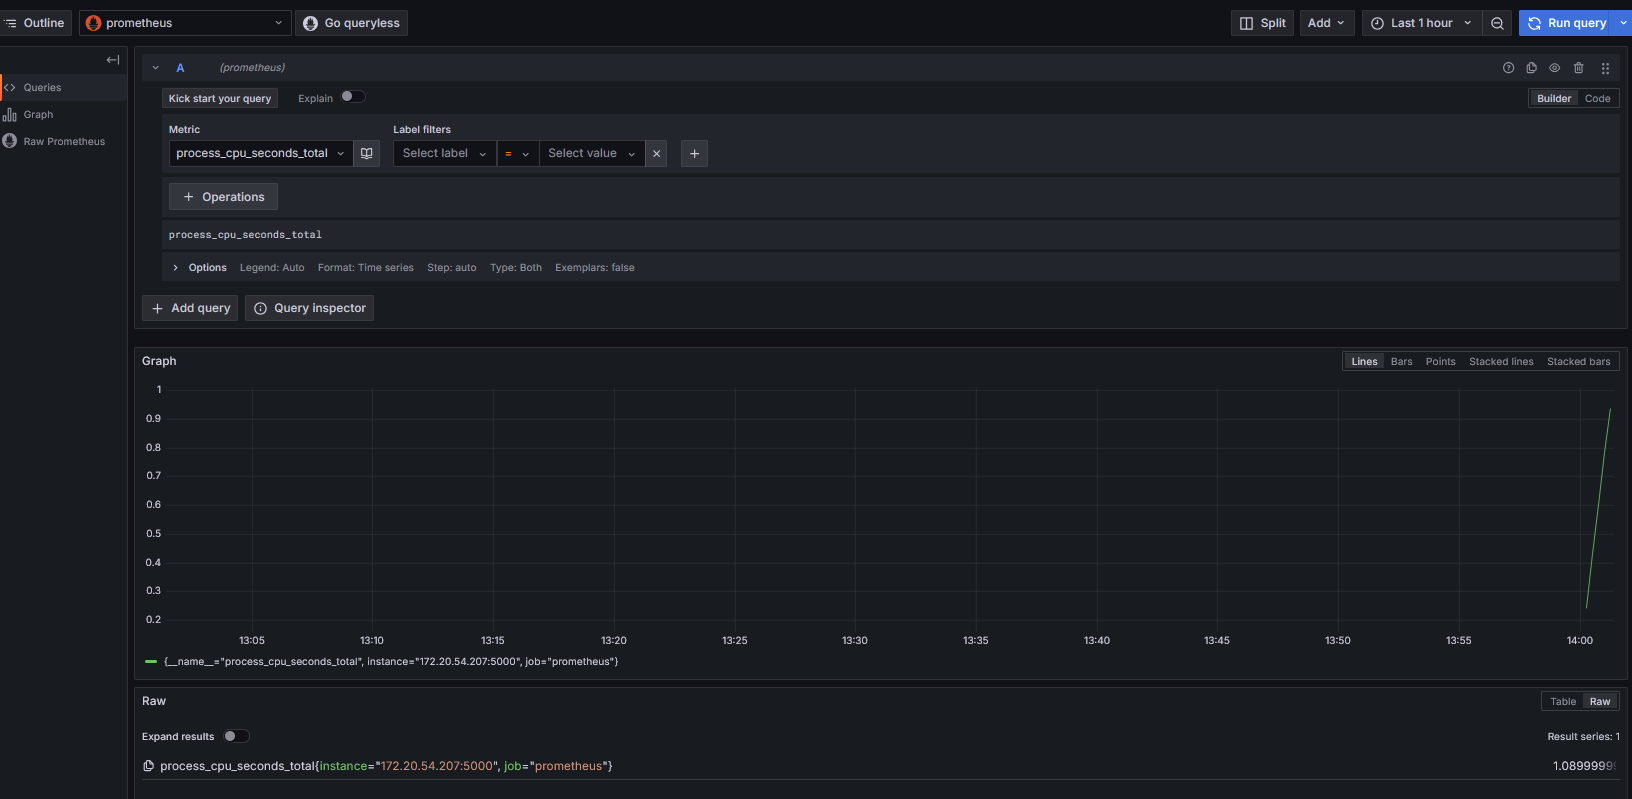
Here’s what the raw metrics look like in Prometheus. Grafana takes this data and turns it into easy-to-understand visual dashboards.